
Market regime
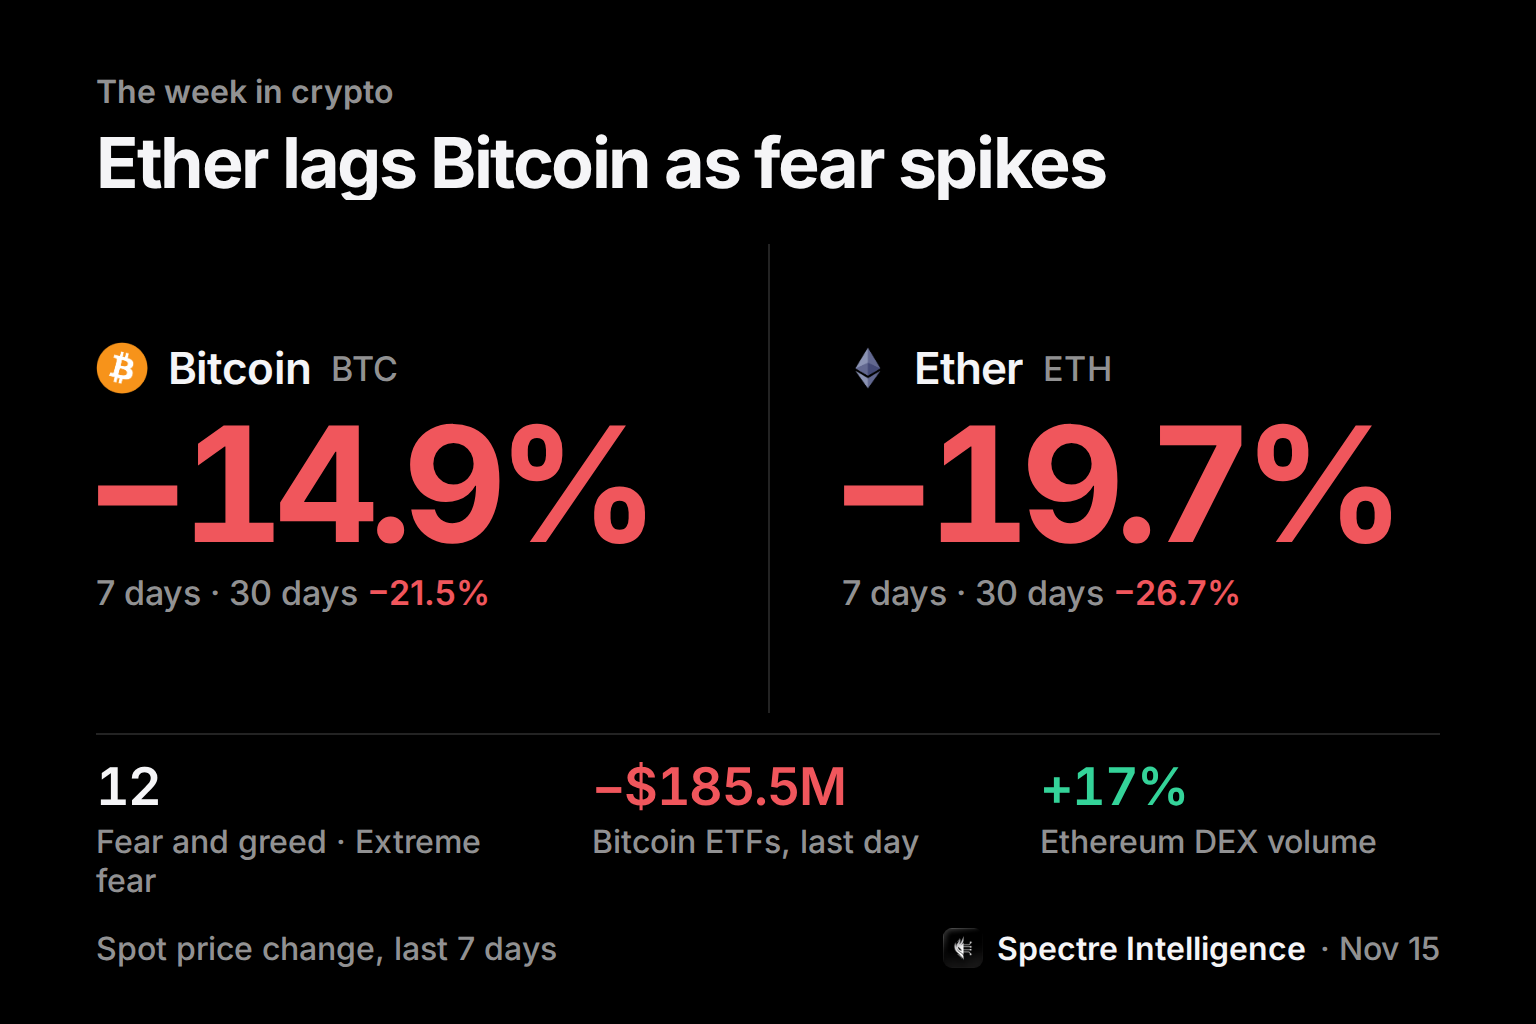
The market sits in extreme fear, with a modest 4% drop in total crypto cap and Bitcoin commanding roughly 59% of the space.
- Market cap change -3.94%
- Fear score 12 (extreme fear)
- BTC dominance 58.6%
- BTC price $63,942
- BTC 7d -14.88%
- ETH 7d -19.7%
Price performance
Ethereum’s price has slipped more than Bitcoin, extending its lag over the past week.
- BTC 7d -14.88%
- ETH 7d -19.7%
- BTC 30d -21.48%
- ETH 30d -26.69%
- BTC price $63,942
- ETH price $1,781.01
DEX volume shift
Liquidity is moving toward Ethereum and Base while Solana’s on‑chain activity contracts.
- Ethereum avg $5.23B (+16.84%)
- Solana avg $2.37B (‑4.63%)
- Base avg $5.42B (+13.76%)
- Ethereum last 24h $6.69B
- Solana last 24h $2.84B
- Base last 24h $6.92B
Narrative activity
Social chatter shows a tilt toward cat‑driven memes and away from Robinhood‑related tokens.
- Cats 911 posts (1.12x 7‑day avg)
- Robinhood 1,098 posts (0.64x 7‑day avg)
- Solana Memes 1,470 posts (0.74x 7‑day avg)
- AI Agents 1,236 posts (0.86x 7‑day avg)
- Smart Contract Platform chatter 6,756 posts
- Solana Ecosystem chatter 2,163 posts
ETF flows
Bitcoin ETFs recorded net outflows while Ethereum saw a modest net inflow, underscoring divergent institutional sentiment.
- BTC net -$185.45M
- ETH net +$2.36M
- BTC IBIT -$143.53M
- BTC FBTC -$41.92M
- ETH FETH +$11.64M
- ETH ETH -$9.28M
Live tracker: Crypto market today, today’s numbers, updated through the day.
What to watch
- BTC price support test
- Ethereum whale inflows
- Solana meme narrative trend
Questions readers ask
Why is Ethereum lagging Bitcoin?
Ether has fallen 19.7% over 7 days versus Bitcoin’s 14.88% loss, amid an extreme‑fear regime and Bitcoin’s near‑59% dominance, while large ETH whale inflows have not translated into price strength.
What does the DEX volume shift indicate?
Ethereum’s daily DEX volume rose 16.84% to $5.23 B and Base up 13.76% to $5.42 B, suggesting traders are moving liquidity to the dominant chains, while Solana’s volume slipped 4.63% to $2.37 B, reflecting a rotation away from it.
Are meme narratives influencing market direction?
Cats meme activity is 12% above its 7‑day average, whereas Robinhood chatter is 36% below, showing a shift toward cat‑driven memes and away from Robinhood tokens, but the overall market move remains driven by price and liquidity factors.
Sources
- SEC EDGAR: 8-K - iShares Staked Ethereum Trust ETF (0002099103) (Filer)
- The Block: Ethereum and Layer 1s Explained
- Cointelegraph: Are Alt-L1s over? Security, costs drive smaller chains to Ethereum
- Decrypt: Morning Minute: Vitalik Recasts ETH as a Store of Value
- Spectre crypto: Ethereum (ETH) Analysis — Price, Fundamentals & Outlook | Spectre Intelligence
- Spectre research: BAT bleeds after limited‑run card game launch stalls
- lookonchain: Community post
- SEC EDGAR: 8-K - iShares Ethereum Trust ETF (0002000638) (Filer)
- Spectre Search: "what is the market doing"
- Spectre evidence snapshot for this article (2026-11-15)
See a discrepancy? Send the article URL and supporting evidence to spectre@spectreai.io.
Explore Spectre